Graphs
Published .The concept we chose for our project, Planet Suburbia, does a pretty interesting thing when it comes to in-game resources: money and health is the same thing. The explaination behind it is that you have the job of defending the planet. You can spend your companys money to up your defences, but it also gets drained when the invading aliens manages to land on the planet. If you go over budget, you get an angry phone call from your boss who tells you that you're fired.
When we came around to coming up with concepts for the game's UI we needed a good way to display this resource. Since it's important to keep an eye on it during gameplay it needs to be easy to see during gameplay. A basic metre with a number slapped on it would've worked, but we felt that it wouldn't really fit in this economic theme for the game. The first alternative we came up with when we thought of economics was graphs.
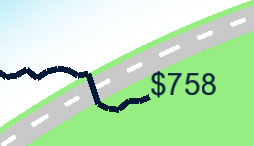
This week, it was my job to work on the HUD, with the HP/Money graph being part of it. I wouldn't say that is was hard to implement, but it did cause some issues that were time-consuming to fix. But anyway, here it is, in its functional, unfinished glory:

The things missing are an actual background, a font for the numbers that isn't arial and some polishing to get rid of those "cracks" in the graph. It will probably also start flashing red when you get dangerously low, but we'll see how that turns out.
The way it works is pretty simple: Each time it updates it creates a line between the previous money value and the current one and moves all the previously created lines back one "step" (the horizontal distance between two lines) before adding the new line into the vector.
Now when I say 'line', I actually mean a sf::RectangleShape, since there isn't a line class in SFML. And since [I've already explained]({% post_url 2016-02-18-aimbotting-for-turrets %}) the logic behind the basic trigonometry in doing this, I'll do the quick rundown: You have two points that you want to draw a line inbetween aswell as the line's width. You calculate the distance between the two points and set it as the rectangles length, then calculate the angle using atan2() and use that for the rectangles rotation and finally set the rectangles height as the provided width for the line. Done.
Sorry for those incredibly bad last few sentences.